Pulling and Splitting live XML with Logstash

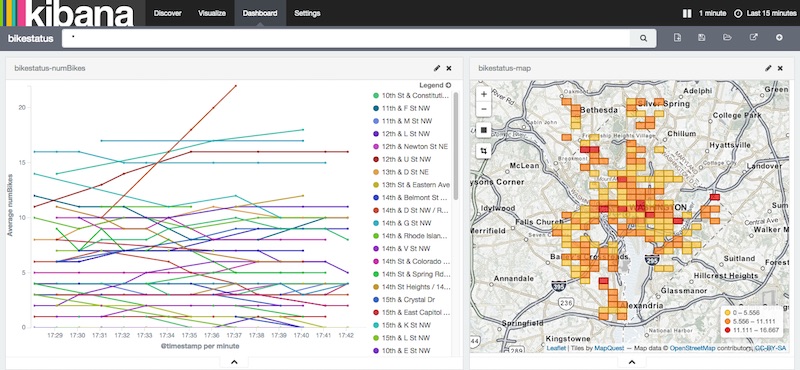
As someone who demos Elasticsearch and Kibana quite a bit, the new “http_poller” input to Logstash [1] is probably the most useful tool I have yet run into for quickly cooking up real-time demos for Elasticsearch that use live data.
Here’s a quick outline of what I’m going to do in logstash:
## Outline
input {
  http_poller {  }
}

filter {
  xml {  }
  split {  }
  mutate {  }
  date {  }
}

output {
  stdout { codec => dots }
  elasticsearch {  }
}

We start with the poller. This is the part I love. No more writing cron jobs and tiny python scripts just to get get data from the web on a schedule. In order for this to work you have to install the plugin using Logstash’s new ruby gem based plugin install feature. In this case I’m grabbing the Captial Bikeshare station avaialability XML web endpoint every 60 seconds.
input {
  ## pull data from Capital Bikeshare every 60 seconds
  http_poller {
    urls => {
      bikeshare_dc => "https://www.capitalbikeshare.com/data/stations/bikeStations.xml"
    }
    request_timeout => 30
    interval => 60
    codec => "plain"
    metadata_target => "http_poller_metadata"
  }
}
Each pull is a huge XML file. Inside this file is a list of enumerated station data inside a series of tags all called <station> . You can do a one time pull with your web browser by hitting the following link:
https://www.capitalbikeshare.com/data/stations/bikeStations.xml
the format is something like this:
  <stations>
    <station> ... </station>
    <station> ... </station>
    <station> ... </station>
    ...
At this point in our logstash pipeline, the XML payload is entirely in the “message” field as a string. The first step is to tell Logstash to interpret that string as XML and put the deserialized data into a field called “parsed”.
  ## interpret the message payload as XML
  xml {
    source => "message"
    target => "parsed"
  }
Next we split the big XML event into a separate event per station with the split command. Rather than keep everything in there, we’ll just pull out a couple of specific values that I want.
  ## Split out each "station" record in the XML into a different event
  split {
    field => "[parsed][station]"
    add_field => {
      ## generate a unique id for the station # X the sensor time to prevent duplicates
      id                  => "%{[parsed][station][id]}-%{[parsed][station][lastCommWithServer]}"
      stationName                => "%{[parsed][station][name]}"
      lastCommWithServer  => "%{[parsed][station][lastCommWithServer]}"
      lat                 => "%{[parsed][station][lat]}"
      long                => "%{[parsed][station][long]}"
      numBikes             => "%{[parsed][station][nbBikes]}"
      numEmptyDocks        => "%{[parsed][station][nbEmptyDocks]}"
    }
  }
Next we do some type correction, correct formatting for the geospatial point, and interpretation of the source date.
  mutate {
    ## Convert the numeric fileds to the appropriate data type from strings
    convert => {
      "numBikes"       => "integer"
      "numEmptyDocks"  => "integer"
      "lat"           => "float"
      "long"          => "float"
    }
    ## put the geospatial value in the correct [ longitude, latitude ] format
    add_field => { "location" => [ "%{[long]}", "%{[lat]}" ]}
    ## get rid of the extra fields we don't need
    remove_field => [ "message", "parsed", "lat", "long", "host", "http_poller_metadata"]
  }

## use the embedded Unix timestamp
 date {
    match => ["lastCommWithServer", "UNIX_MS"]
    remove_field => ["lastCommWithServer"]
  }
And we wrap up by inserting the result into Elasticsearch
output {
  # stdout { codec => rubydebug }
  stdout { codec => dots }
  elasticsearch {
    ## use a time aware index name
    index => "bikestatus-dc-%{+YYYY.MM.dd}"
    protocol => "http"
    ## not super important, but it makes sense to override the default which is "log"
    document_type => "bikestatus"
    ## use the generated id as the document id to prevent duplicates
    document_id => "%{[id]}"
  }
}
It’s super important to set up the Elasticsearch mapping before indexing and data (a.k.a. running logstash with this config file). The following mapping template tells Logstash what kind of mapping to set up every time logstash starts an index for a new date. Note the special handling on the geospatial value to make sure we use the latest and greates features of Elasticsearch 1.5.2+ . The setting “geohash”: true is especially important. Without that we won’t really being doing any geo-indexing.
PUT _template/bikestatus
{
  "template": "bikestatus-*",
  "settings": {
    "number_of_shards": 1,
    "number_of_replicas": 0
  },
  "mappings": {
    "_default_": {
      "dynamic_templates": [
        {
          "string_fields": {
            "mapping": {
              "index": "not_analyzed",
              "omit_norms": true,
              "type": "string",
              "doc_values": true
            },
            "match_mapping_type": "string",
            "match": "*"
          }
        }
      ],
      "_all": {
        "enabled": false
      },
      "properties": {
         "@timestamp": {
          "type": "date",
          "format": "dateOptionalTime",
          "doc_values": true
         },
        "location": {
          "type": "geo_point",
          "geohash": true,
          "fielddata" : {
            "format" : "compressed",
            "precision" : "20m"
          }
        },
        "numBikes": { "type": "integer","doc_values": true },
        "numEmptyDocks": { "type": "integer","doc_values": true }
      }
    }
  }
}
and to make Kibana more intelligent about looking at recent data, we’ll use a time based index pattern when making our index pattern in Kibana
[bikestatus-dc-]YYYY.MM.DD
the complete code can be found here [2]
- [1] http_poller
- [2] full source code