2016 Quantified Year in Review
At the beginning of the year I set out on a Quantified Self challenge. Some tracking activities dropped off after only a few weeks (like movie and tv tracking). I blame the manual entry required during couch time when I don’t feel like pulling out my phone. On the other hand, checking in all my beers to Untappd was easy to keep up, and the main reason was that I had a near-real-time visualization service running all year long to help reinforce the completionist part of my brain that wanted the visualization to be accurate … or just funny due to the hilarious beer names.
Only the data sources that logged without me having to take extra action or had instant gratification dashboards lasted the whole year. I suspect this will inform my Quantified Self efforts for 2017.
Steps
I started the year actually wearing two “smart-watches”, putting on both a first generation Apple Watch and my Fitbit Charge HR. The Apple watch became the watch I wanted to have on my wrist, but getting step data off the apple watch given the privacy protections and complete lack of non-native app APIs to access apple health data proved extremely difficult. So the Apple watch became my watch with fitbit being my real-time tracker. Due to app synching issues, halfway into the year I stopped pulling my steps in real time or even daily. These days I only wear the Apple watch, whcih means the following graphs are generated by manually (yuck) pulling the data off my phone using QS Access, proccessing the data with a small python program, and loading into my Elastic cluster.
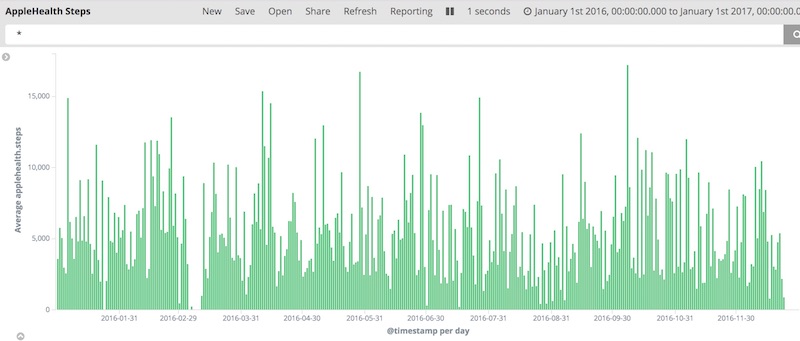
Depsite being a data black whole, and having no out-of-the-box support for moving data from one phone to another, the one advantage of Apple devices is that the watch’s step counter and phone’s acceleromater step counter are merged by the apple health app. Even on days when I didn’t wear the apple watch I’ll get some data from the phone’s sensor’s directly.
Travel
I track all my work and fun travel in TripIt. I took 25 trips in 2016. That’s leaving home every other week. Most of the trips were to cover my cusomters, who range up and down US East.
Beer
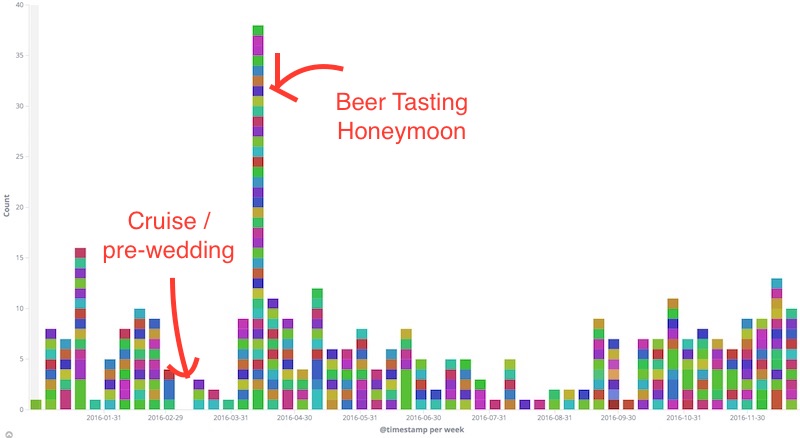
I track the beer I drink in Untappd. My wife is something of a beer connoisseur, so we’ve picked up the fun hobby of trying to drink beer we haven’t had when we are out on the town or picking out mixer-six packs at the local craft beer shop to split at dinner.
In the visualization you can see the week we took a cruise to the Carribean (and left the cell phone off) as well as the massive spike for a brewery tour in Charlottesville, VA right after getting married:

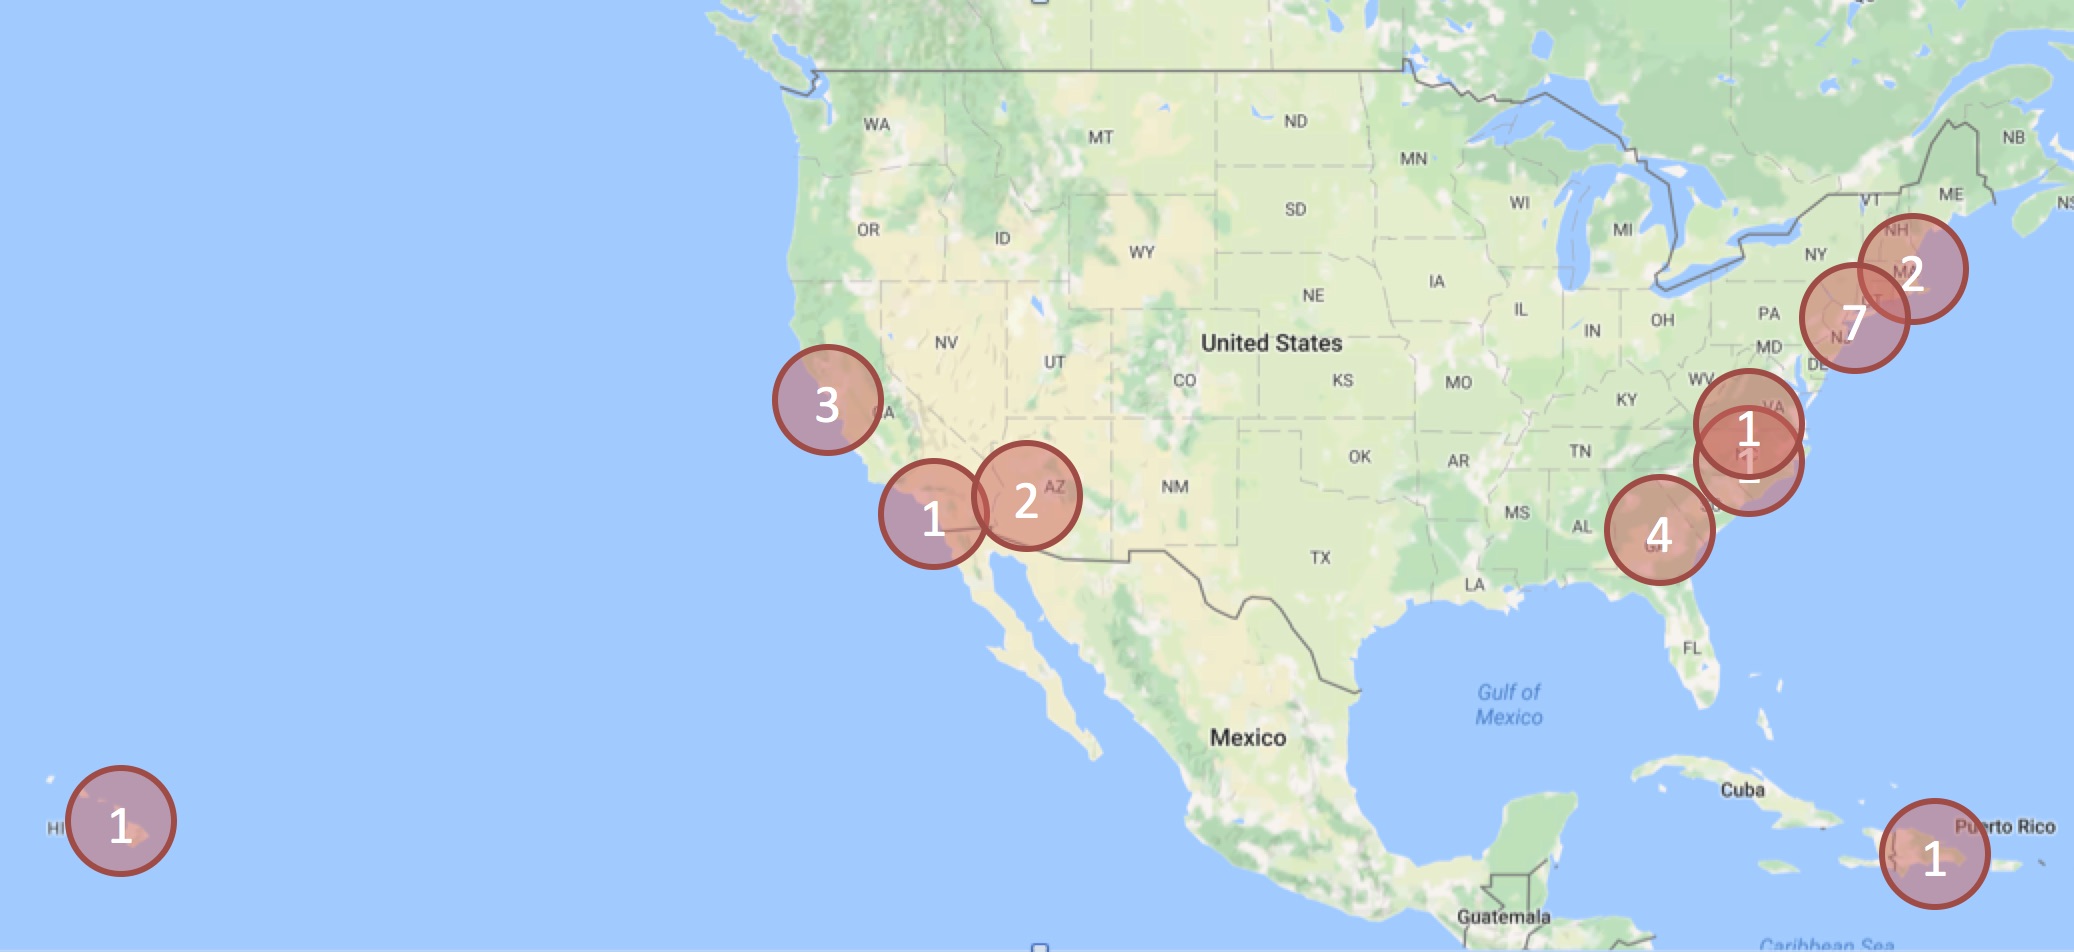
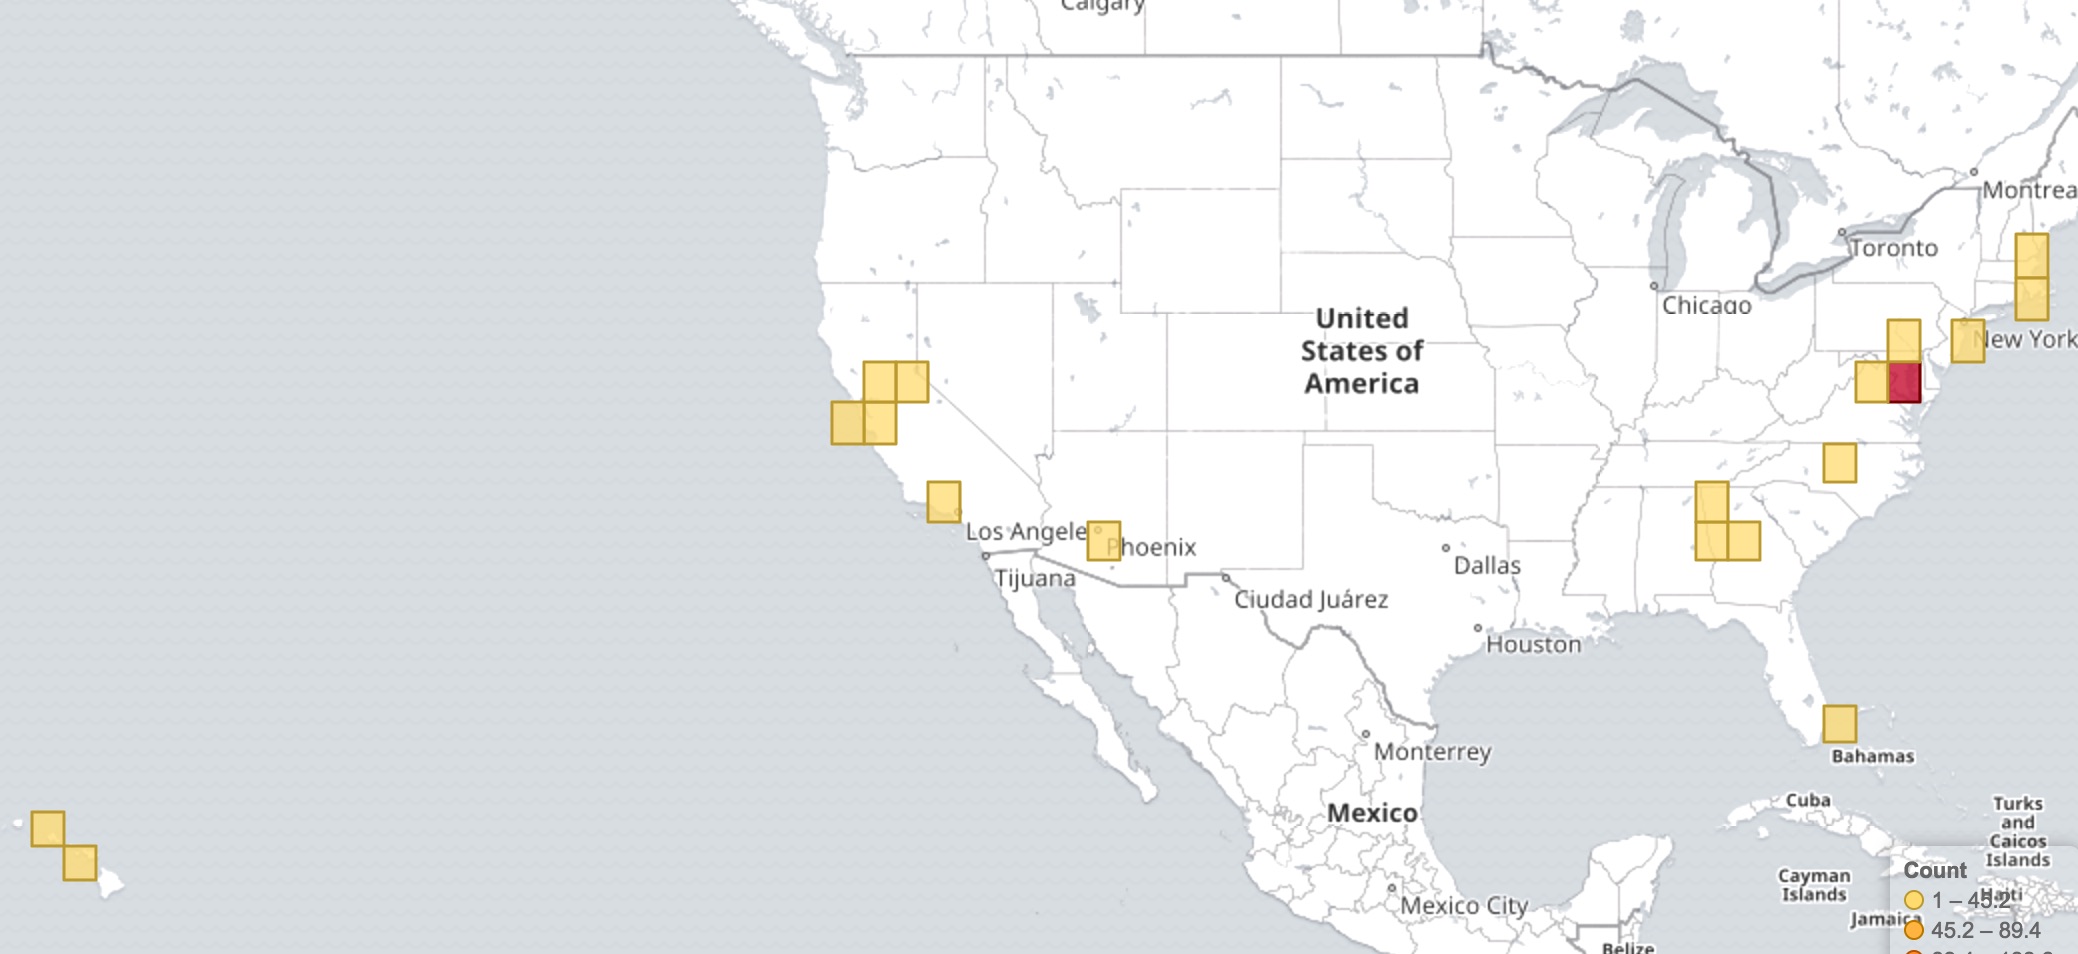
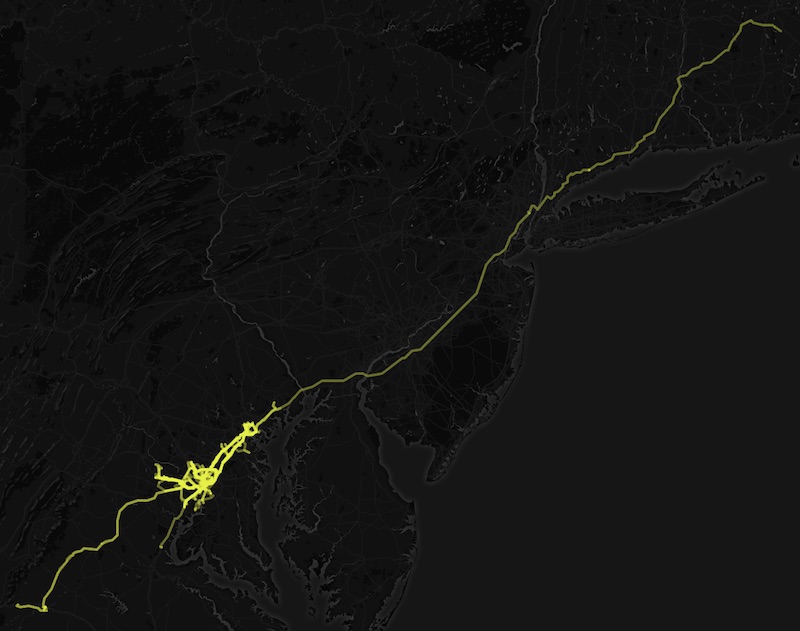
Here is a map of the locations where that beer was consumed:
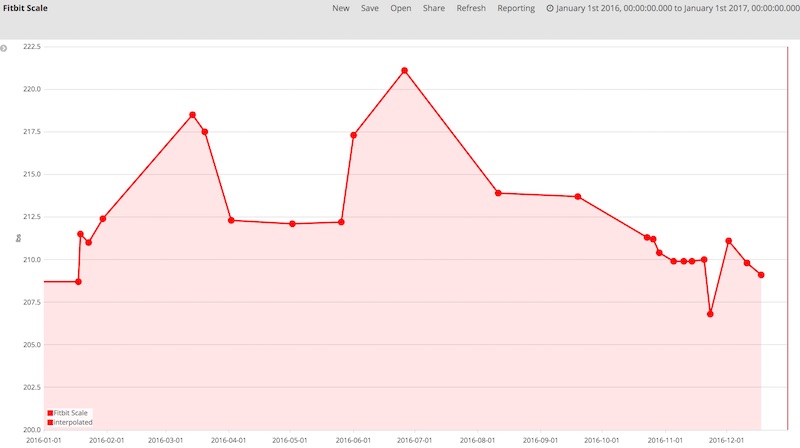
And here is the impact on my waistline, the data from my fitbit scale:
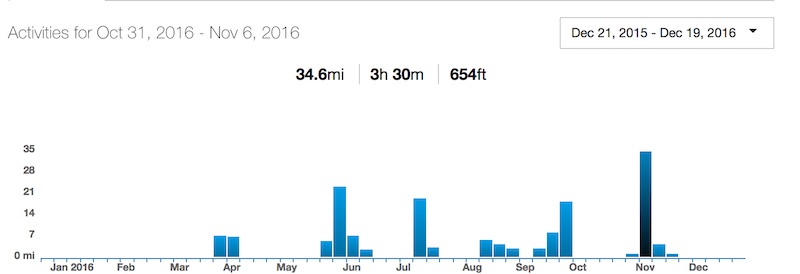
Bicycle
I transferred all my data from Endomondo to Strava this year. The visualizations aren’t as good but Strava is the app people I know seem to be using, so I’ve gone with my social network. I’ll ride more when the weather gets better so I look forward to trying Strava’s features tracking improvement for sections of one’s common routes.
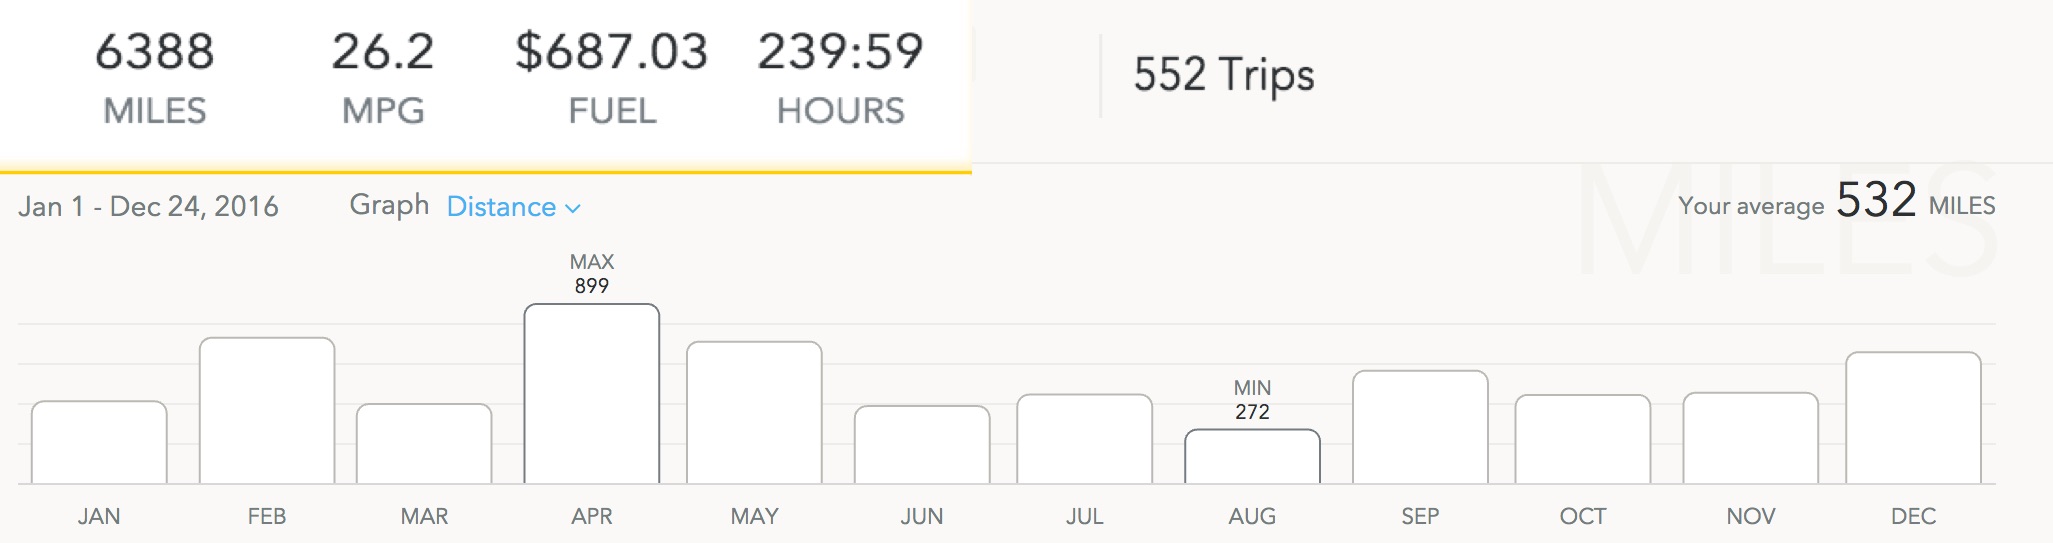
Car
I use an Automatic IOT sensor on my car. The app does all the data tracking for me and spits out some fun visualizations
Other Stats
| Stat | Count |
|---|---|
| Roller Derby Games Officiated | 10 |
| Role Playing Game Sessions Run | 3 |